
.jpg)
40 Most Profitable Restaurant Franchises: The ROI Guide & 2026 Ranking

.png)
Stop losing guests to AI. Watch the exclusive session to audit your visibility and outrank every local competitor.
In 2026, the restaurant franchise industry continues to prove its resilience. However, the very idea of profitability for restaurant chains is changing.
Unit economics, AI revolution, digital presence, cash flow velocity... The most profitable franchises in the US today aren’t just revenue machines.
They are focused on smart profit margins, data-based insights and strategies, SEO for restaurant chains, AI-fueled automation, scalable and sustainable profitability, and high operational leverage.
Whether you’re investing $500K or $5M+, you need data-backed clarity, financial discipline, strategic execution and online marketing mastery.
In this guide, we break down the top 40 most profitable restaurant franchises in the US, and explain exactly how to evaluate a franchise’s true ROI, using benchmarks from brands like McDonald’s, Chick-fil-A, Bojangles, Domino’s, and more.
NEW! Get your locations ready for the 2026 World Cup👇
1. What is Franchise Profitability?
Understanding franchise profitability from an operator-investor perspective is quite different than from a single-location manager.
Profitability in franchising isn’t just sales. It’s the intersection of:
Most importantly, it's crucial to understand that high AUV ≠ high profit.
Some brands have $3M+ AUVs, but 5–7% profit margins due to heavy labor or rent burdens. On the other hand, others generate $1.2M with 18% net margins and faster breakeven.
Again, your business model will vary depending on your size, location, concept, etc.
In 2026, opening in a high-traffic area with a strong brand is no longer "enough" to break even.
Before diving into operational drivers and digital growth strategies, it’s essential to understand financial metrics that top franchise operators track in 2026, far beyond AUV or topline sales.
Franchise Profit ≠ Foot Traffic Alone
Profitability in restaurant franchising in 2026 isn’t just about chasing brands with high AUVs.
It’s about backing proven operational models that deliver repeatable, bankable cash flow.
The smartest operators this year are focusing on:
- Multi-unit deals with EBITDA-positive brands
- Drive-thru-only and modular builds to reduce capex
- Maximizing labor efficiency and SKU simplicity
- Value-focused marketing and digital channels
Franchises like Chick-fil-A, Bojangles (boneless format), and Hawaiian Bros prove that simplicity scales, and that profitability isn’t just possible, it’s programmable when you focus on the right metrics.
The Top Key Analytics & Metrics to Evaluate Franchise Profitability
2. Top 40 Most Profitable Restaurant Franchises in the US in 2026
*Ranked by AUV, systemwide sales, unit count, and investment ROI.
We analyzed 100+ top brands across QSR, fast casual, bakery, coffee, and pizza, and selected the top 40 based on revenue performance, margin profiles, and growth potential.
3. Growth Marketing: Why Digital Drives Revenue for Restaurants
Franchise Profit: Using Marketing Strategy for Growth
For multi-unit brands and franchise operators, the biggest shifts in profitability now come from how efficiently each location converts online demand into revenue. The operators outperforming the market are not the ones with the biggest marketing budgets, but the more efficient ones (from 5 to 10% of a location's revenue).
Top priorities:
-Create guidelines for the whole network to maximize the effect
-Centralize data across locations and automate 80% actions (Pareto law)
-Build a full stack connected ecosystem (from CRM to booking tools)
-Turn marketing data like reviews and search behavior into operational KPIs or revenue
-Use online visibility for growth: capture high-intent customers online directly through digital channels
-Make every location “unmissable” on search engines, AI, social media, etc.
Digital visibility → operational visibility → revenue uplift
Top executives now monitor digital data the way CFOs monitor cash flow: monthly, per location, with clear actions.
Franchises today rely on digital signals to understand their business in real time.
For example, Semantic analysis of negative reviews identifies recurring operational issues.
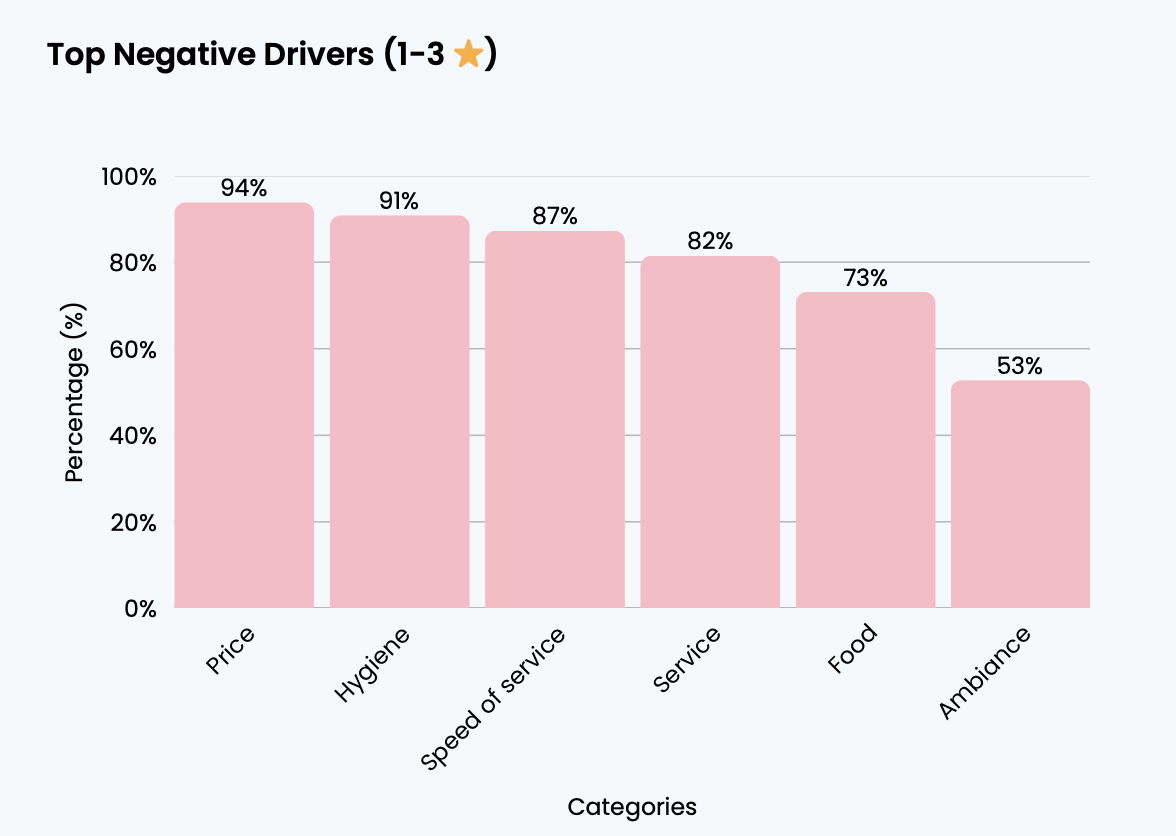
Top executives can pinpoint, understand and eventually predict negative or positive drivers for each location, monthly, and then, take action immediately.
Restaurants' online reviews can be leveraged for growth in operations, and in marketing. Collecting and answering online reviews helps increase Google ratings as well as brand's visibility.
And it shows 👇
⭐ E-reputation is now a revenue engine: According to Harvard Business Review, gaining +1 star on Yelp drives a +9% boost in revenue for restaurants.
To get ahead, digital visibility is no longer optional:
- 72% of customers choose a restaurant based on local Google ratings and content.
- 47% of searches include "near me" (local SEO) and Google ranks relevance, distance, and prominence, not brand name.
Groups using the MalouApp gain on average +174 new customers/month/location (tracked lift) and see a +4.7% average revenue increase/month.
As well as:
- Time saved through automated review responses and bulk GBP updates = 1-click updates to 100+ Google Business Profiles to boost Presence management
- Automated, tone-customizable SEO posts and social media content
- Better margin control thanks to insights extracted from reviews.
Marketing = margin multiplier.
Growth for franchises in 2026 will rely on automation gains with AI-fueled marketing tools, from top ROI tool like Malou to new free marketing tools.
68% of CMOs and CTOs in restaurant groups declared that AI tools and automation have now surpassed paid media as their top investment priority (Source: FS/TEC Conference).
AI profitability: Higher conversion rates
AI-powered discovery is reshaping the way clients find you online.
1 out of 5 American already uses an AI to pick a bar or a restaurant. That number goes up to 40% for younger generations.
Restaurant chains have to face a challenge: adapt to the way AI changes hospitality, and seize a huge financial opportunity, or, risk a "tech gap" and become invisible by keeping traditional methods.
💰$1.48 trillion dollars: That’s the estimated financial impact of Generative AI on the hospitality market, according to FirstPageSage.
The new AI profitability formula includes:
- Using AI tools like Malou to grow faster and scale ;
- Adapting to AI-discovery, using GEO and AIO to rank first on ChatGPT or AI Overview.
📈 It's estimated that AI will have twice the conversion rate of Google: ~6.7% vs ~3.9%, according to All About AI. For ~700M weekly AI users, that’s over 46 million potential diners up for grabs!
Don't let AI decide for you. Watch our webinar "How Restaurants can leverage AI for profit"
Franchises Betting on Their Core Asset: Turning Brand Power Into ROI
At the end of the day, the strongest advantage a franchise has is its brand.
It's where they need to keep their focus to grow, as well as their greatest asset and core value.
The groups winning in 2026 are the ones that turn their brand into a digital moat: consistent across hundreds of locations, visible everywhere customers search, and reinforced every day through reviews, ratings, and AI discovery.
Your priority is simple: Make your brand and every location impossible to miss.
Groups that succeed always manage to balance a strong core brand with hundreds of locations across the country. That’s how franchises scale faster, convert more customers, and unlock higher, more predictable profitability.
Let's talk growth strategy for franchises? Call one of our experts at +1 (929) 483 0848 or run a free restaurant diagnosis.
Want more business inspiration? Check out our articles:
- Top Dessert Brands Ruling America in 2026
- The Best French Restaurateurs in the US.
FAQ - Expert Franchise Profitability (2026 Edition)
1. What is a good EBITDA margin for a restaurant franchise?
A healthy EBITDA margin for restaurant franchises in 2026 generally ranges between 12% and 20%, depending on the model.
Top-performing QSR and fast casual brands can exceed 18%, especially those with:
- streamlined labor operations
- simplified SKU and production flows
- strong digital demand generation (SEO, GBP, reviews, AI discovery)
- lower occupancy costs
Brands with EBITDA under 10% often struggle to scale unless they have unusually strong AUV growth or a low-cost expansion model.
In today’s market, EBITDA performance is increasingly tied to digital visibility: franchises ranking well on Google, Maps, and AI-powered recommendation engines (ChatGPT, Gemini, Perplexity) often see significantly stronger unit economics.
2. How do you evaluate ROI for a restaurant franchise?
ROI for franchises in 2026 is measured through cash-on-cash return, not just AUV or topline sales.
A strong franchise ROI includes:
- Payback period: 2–4 years for best-in-class brands
- Cash-on-cash return: 20–35% for top QSR operators
- Margin stability: consistent EBITDA month over month
- Digital CAC (customer acquisition cost through digital channels)
- Review velocity & rating: which directly affect local conversion rates
- AI visibility: inclusion in ChatGPT/Gemini recommendations, which now convert at 2× Google’s traditional search rate
Digital visibility (SEO, GBP, reviews, store locator pages) is now one of the largest ROI multipliers, because 72%+ of customers choose a restaurant based on local ratings and search results.
3. What AUV is considered profitable for a franchise?
AUV becomes “profitable” only when paired with healthy margins.
In 2026 benchmarks:
- AUVs around $1.2M–$1.8M can be more profitable than $3M+ AUV brands if their labor, COGS, and occupancy percentages are optimized.
- High AUV brands with weak margins (5–7%) underperform compared to moderate AUV concepts with strong EBITDA (15–20%).
Profitability = AUV × margin efficiency × digital demand.
Brands dominating local search, AI discovery, and Google ratings often achieve significantly higher revenue-to-profit conversion, making a “lower” AUV franchise much more lucrative.
4. How does AI impact franchise profitability in 2026?
AI is now one of the strongest profitability levers for restaurant groups and franchises. It impacts revenue through:
AI-powered discovery (GEO / AIO)
Tools like ChatGPT, Gemini, and Perplexity are becoming new restaurant search engines.
Brands cited in AI responses enjoy:
- 2× higher conversion rates than Google
- More high-intent customers
- Faster reservation & ordering decisions
Operational efficiency
AI automates:
- inventory forecasting
- labor scheduling
- price adjustments
- marketing execution
→ reducing costs and improving margins.
Digital prominence = revenue
AI relies heavily on:
- structured data
- consistent listings
- review velocity
- webpage quality
- local landing pages
Franchises with strong presence management and GEO-optimized structures see:
- +48% Google Maps visibility
- +174 customers per month per location (tracked lift)
- +4.7% revenue uplift
In 2026, profitability is inseparable from AI visibility and digital performance.

.jpg)
.jpg)
We put The double bites to satisfy you
Increase your visibility on Google and social networks with Malou.
